pydash is a lightweight web-based monitoring tool for Linux written in Python and Django plus Chart.js. It has been tested and can run on the following mainstream Linux distributions: CentOS, Fedora, Ubuntu, Debian, Arch Linux, Raspbian as well as Pidora.
You can use it to keep an eye on your Linux PC/server resources such as CPUs, RAM, network stats, processes including online users and more. The dashboard is developed entirely using Python libraries provided in the main Python distribution, therefore it has a few dependencies; you don’t need to install many packages or libraries to run it.
In this article, we will show you how to install pydash to monitor Linux server performance.
How to Install pyDash in Linux System
1. First install required packages: git and Python pip as follows:
-------------- On Debian/Ubuntu --------------
$ sudo apt-get install git python-pip
-------------- On CentOS/RHEL --------------
# yum install epel-release
# yum install git python-pip
-------------- On Fedora 22+ --------------
# dnf install git python-pip
2. If you have git and Python pip installed, next, install virtualenv which helps to deal with dependency issues for Python projects, as below:
# pip install virtualenv
OR
$ sudo pip install virtualenv
3. Now using git command, clone the pydash directory into your home directory like so:
# git clone https://github.com/k3oni/pydash.git
# cd pydash
4. Next, create a virtual environment for your project called pydashtest using the virtualenv command below.
$ virtualenv pydashtest #give a name for your virtual environment like pydashtest

Create Virtual Environment
Important: Take note the virtual environment’s bin directory path highlighted in the screenshot above, yours could be different depending on where you cloned the pydash folder.
5. Once you have created the virtual environment (pydashtest), you must activate it before using it as follows.
$ source /home/aaronkilik/pydash/pydashtest/bin/activate

Active Virtual Environment
From the screenshot above, you’ll note that the PS1 prompt changes indicating that your virtual environment has been activated and is ready for use.
6. Now install the pydash project requirements; if you are curious enough, view the contents of requirements.txt using the cat command and the install them using as shown below.
$ cat requirements.txt
$ pip install -r requirements.txt
7. Now move into the pydash directory containing settings.py or simple run the command below to open this file to change the SECRET_KEY to a custom value.
$ vi pydash/settings.py

Set Secret Key
Save the file and exit.
8. Afterward, run the django command below to create the project database and install Django’s auth system and create a project super user.
$ python manage.py syncdb
Answer the questions below according to your scenario:
Would you like to create one now? (yes/no): yes
Username (leave blank to use 'root'): admin
Email address: aaronkilik@gmail.com
Password: ###########
Password (again): ############
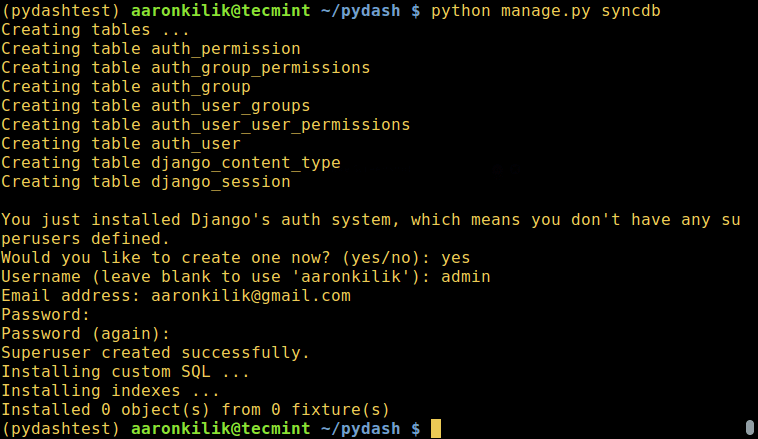
Create Project Database
9. At this point, all should be set, now run the following command to start the Django development server.
$ python manage.py runserver
10. Next, open your web browser and type the URL: http://127.0.0.1:8000/ to get the web dashboard login interface. Enter the super user name and password you created while creating the database and installing Django’s auth system in step 8 and click Sign In.

pyDash Login Interface
11. Once you login into pydash main interface, you will get a section for monitoring general system info, CPU, memory and disk usage together with system load average.
Simply scroll down to view more sections.

pyDash Server Performance Overview
12. Next, screenshot of the pydash showing a section for keeping track of interfaces, IP addresses, Internet traffic, disk read/writes, online users and netstats.

pyDash Network Overview
13. Next is a screenshot of the pydash main interface showing a section to keep an eye on active processes on the system.

pyDash Active Linux Processes
Learned a lot of new things from your post! Good creation and HATS OFF to the creativity of your mind. Very interesting and useful blog!
ReplyDeletePython Training in Chennai
Python Course in Chennai
Thanks for your efforts in sharing this effective tips to my vision. kindly keep doing more. Waiting for more updates.
ReplyDeleteIELTS Coaching in Mulund
IELTS Training in Mulund West
IELTS Courses in Mulund
Best IELTS Coaching Institute in Mulund
IELTS Classes in Mulund
Best IELTS Training Centres in Mulund East
IELTS Classes near me